What Red Rock is
The Red Rock Study (Redrock Island, Redrock Study, "the island game" in some threads) is the data-analysis game in the McKinsey Solve. You're handed a research brief about animal populations on an island, usually wolves, elk or something similar, and asked to pull the right numbers out of it, calculate, write up, and then answer six quick cases on the same theme. It's the first game on every current invitation length (65, 85 and 95 minutes; see the invitation table), and it runs on its own clock. Prep sites and candidates consistently report about 35 minutes. The tutorial before it is untimed.
It's also the game people underestimate. Nothing in it is harder than percentages and averages. Most people who score badly on it did the math fine and lost the points to the structure: a value they didn't collect when they could, a phase they left ten seconds too early, a question that asked for points when they computed percent.
The shape of the game
Two parts, strictly one-way. Part one is a single study in three phases: Investigation, then Analysis, then Report. Part two is six short cases on the same theme, answered one at a time. Once you confirm a phase or a case, it locks. The tools change as you go:
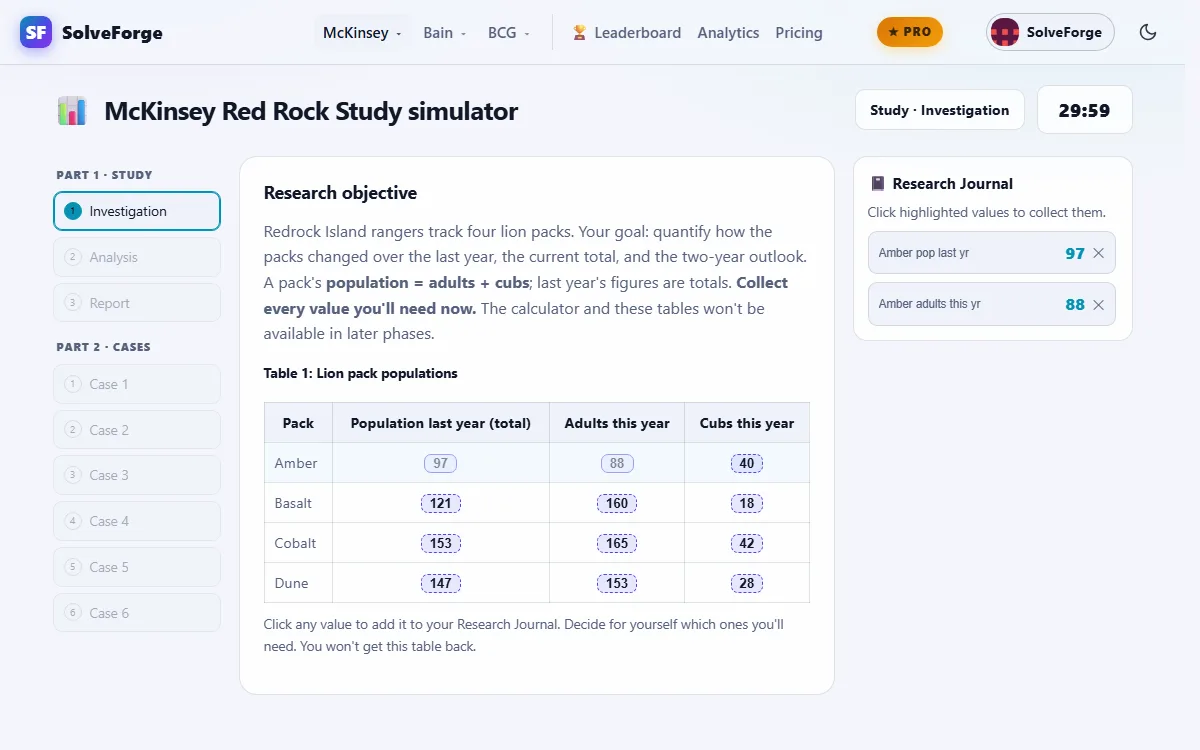
- Investigation: the brief, with text, tables and charts. Your only tool is the Research Journal, which you drag values into. No calculator. Anything you don't collect now, you won't see again.
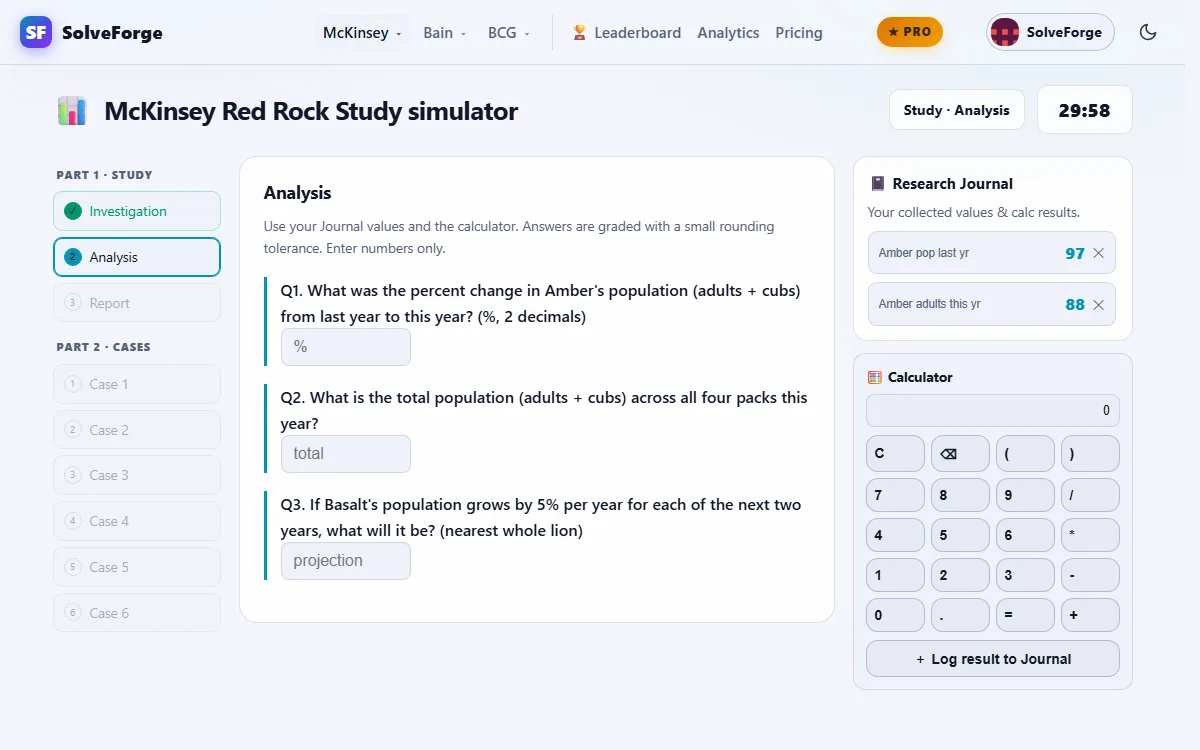
- Analysis: the calculator appears. You answer a few quantitative questions from your collected values, and the answers log back into the Journal.
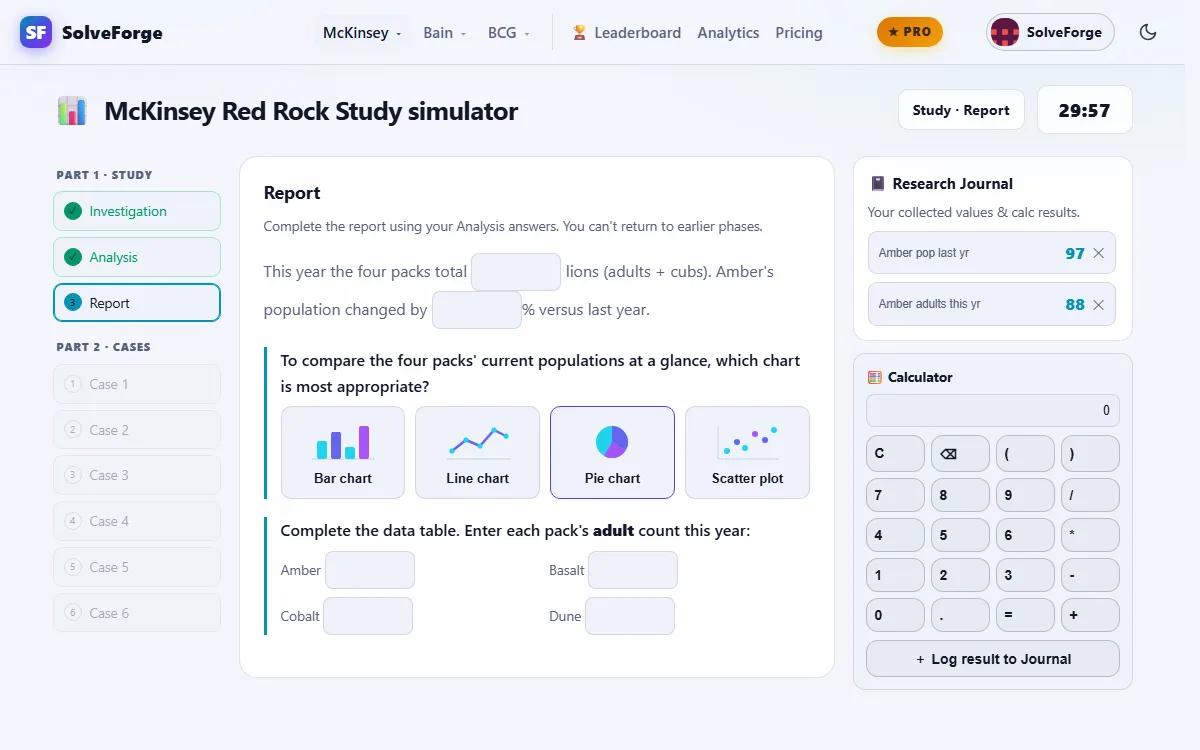
- Report: fill blanks in a written summary, pick the right chart type, complete a table. All from the Journal.
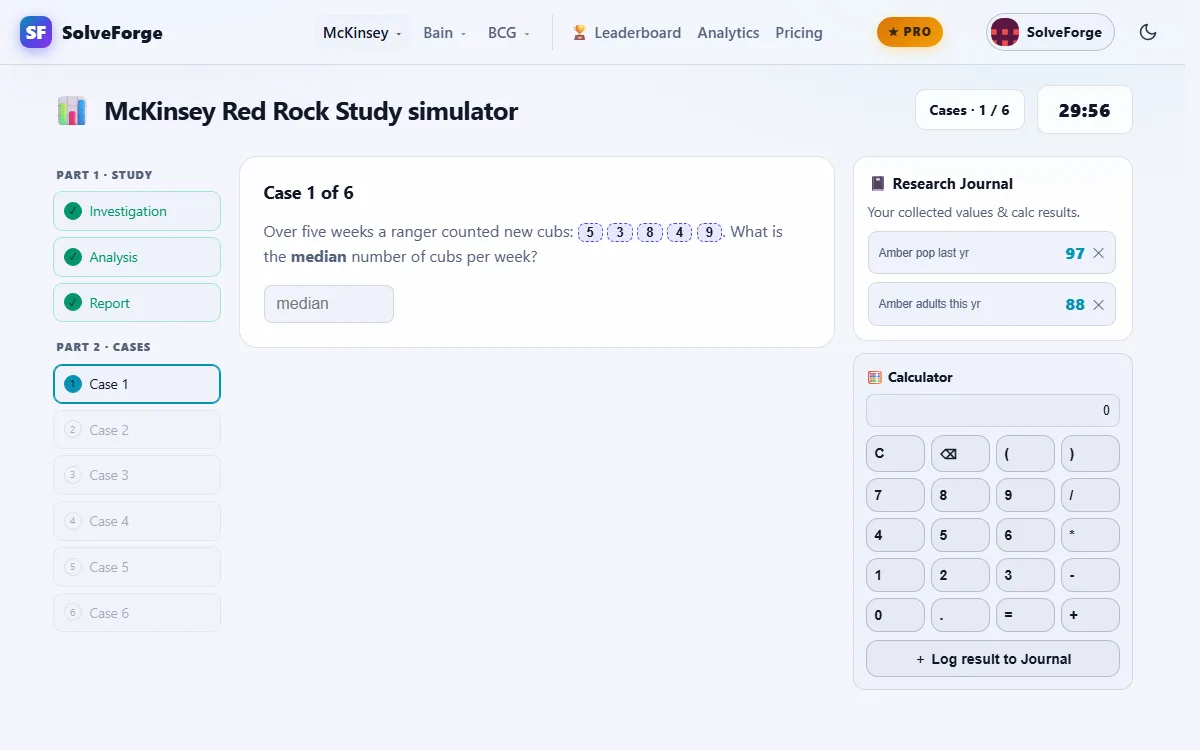
- Cases: six standalone questions, mostly quantitative, against whatever clock is left. They don't use the study's data.
Phase by phase: what each one is watching
Investigation
The brief is deliberately bigger than the task. One prep site puts the share of shown data you'll actually need at 10 to 15%. The skill is knowing what to collect, not collecting everything. Read the research objective first, then the questions the study will ask if they're visible, then collect. Rename the Journal entries as you go, because "value 3" means nothing in Analysis and "Basalt adults this year" means everything. Collect a little more than you think you need. Over-collecting costs seconds; under-collecting costs a question.
Analysis
The calculator arrives and the questions are quantitative: a percent change, a total, a projection, that kind of thing. Every answer you enter is logged to the Journal, which is what you'll build the Report from. One prep site with coaching experience advises doing every calculation on the on-screen calculator, even the trivial ones, because the assessment is reported to record calculator use as part of how it evaluates your process. We can't confirm what's recorded, but there's no downside to following the advice.
Report
A pre-written summary with blanks for your numbers, a comparison word or two (higher, lower), a chart to choose, and a table to complete. If your Journal is in order this is assembly, not thinking. The chart question is the same every time in spirit: bar chart to compare categories, line chart to show change over time, pie chart to show shares of a whole. Read what the sentence says the chart is for, then pick.
The six cases
Six unrelated questions on the same island theme. Candidates report a mix of calculation (medians, percent changes, probabilities, weighted averages), formula or chart selection, and reading a value off a small table. Each locks when you move on. They're worth real points and they come last, which is exactly why people run out of time before finishing them.
A time plan
The reported clock is about 35 minutes, and our simulator runs 35 too. A split that works:
| Phase | On a 35-minute clock | Why |
|---|---|---|
| Investigation | 8 to 10 min | Collect broadly, compute nothing. You can't come back. |
| Analysis | 10 to 12 min | The core math. Slowest phase by design. |
| Report | 5 to 7 min | Assembly from the Journal. |
| Six cases | 8 to 10 min | About 90 seconds each. They're independent; drop the one that stalls you. |
The exact numbers matter less than having decided them before the day. The people who run out of clock are almost always the ones still deciding how long Investigation deserves while Investigation is running. Never sacrifice the cases to polish the Report.
The six traps the questions are built around
Every Red Rock question we've seen described, and every one in our simulator, is built on one of these. Learn them by name and you'll spot them in the wording.
- Totals versus a subgroup. "Population" means adults plus cubs, but the table splits them. Answering with adults only is the trap our simulator's whole study is built around.
- Percent versus percentage points. A rate rising from 40% to 50% is up 10 points and up 25%. The question will ask for one and offer both.
- Compound versus simple growth. Two years at 8% is a factor of 1.08 × 1.08 = 1.1664, not 1.16. Small gap, wrong answer.
- Median versus mean. Five weekly counts; the question says median. Sort first.
- Rates versus raw counts. "Which pack had the most sightings per lion" is not "which pack had the most sightings." Divide before you compare.
- "At least one" versus "both". Two random picks, some chance each is collared. At least one is 1 minus (neither); both is the product. Very different numbers.
A seventh worth knowing: weights that don't sum to 1. If the weights are 0.6, 0.3 and 0.2, a weighted average divides by 1.1, not by 1. The worked cases below hit all of these.
A full study, worked
An original example in the shape of our simulator's scenarios. The real game rotates its numbers and its animals; the decision pattern is what to learn.
Investigation: the brief
Redrock Island rangers track four lion packs. Your objective: quantify how the packs changed over the last year, the current total, and the two-year outlook. The brief says plainly that a pack's population is adults plus cubs. Table 1:
| Pack | Population last year (total) | Adults this year | Cubs this year |
|---|---|---|---|
| Amber | 120 | 132 | 24 |
| Basalt | 95 | 80 | 18 |
| Cobalt | 150 | 160 | 30 |
| Dune | 110 | 98 | 22 |
What to collect: all twelve numbers. It takes twenty seconds and it means Analysis never sends you hunting for something you can't reach. Name them as you go: "Basalt total last year", "Basalt adults", "Basalt cubs". The trap is already visible in the column headers: last year is a total, this year is split. Note that in your head before you lock the phase.
Analysis: three questions
Q1. Percent change in Basalt's population (adults plus cubs) from last year to this year. This year: 80 + 18 = 98. Last year: 95. Change: (98 − 95) / 95 = 0.0316, so +3.16%. The adults-only answer is (80 − 95) / 95 = −15.79%, a decline, which is the number you'd get by skimming the table. Same pack, opposite conclusion.
Q2. Total population across all four packs this year. (132 + 24) + (80 + 18) + (160 + 30) + (98 + 22) = 156 + 98 + 190 + 120 = 564. Adults only gives 470, and 470 will be waiting for you as an option.
Q3. If Cobalt's population grows 8% a year for each of the next two years, what will it be? Cobalt now: 190. Two years compound: 190 × 1.08 × 1.08 = 190 × 1.1664 = 221.6, so 222. Simple growth (190 × 1.16) gives 220.4, rounds to 220. Two lions apart, and only one of them is right.
Log all three to the Journal. You need them in a minute.
Report
"This year the four packs total 564 lions (adults plus cubs). Basalt's population changed by +3.16% versus last year." Then the chart: "To compare the four packs' current populations at a glance" is comparing categories, so a bar chart. A line chart is for change over time and a pie chart for shares of a whole; neither fits "compare four packs." Then the table: each pack's adult count this year, which is 132, 80, 160, 98. Read the word adult. After ten minutes of adding cubs to everything, the table quietly asks for the other thing.
The six cases, worked
Case 1 (median). Weekly new-cub counts over five weeks: 4, 9, 3, 7, 5. Median? Sort: 3, 4, 5, 7, 9. Middle value: 5. The mean is 5.6 and it's the wrong answer to this question.
Case 2 (percent, not points). Cub survival rose from 40% last season to 50% this season. By what percent did it increase? (50 − 40) / 40 = 25%. "10" is the percentage-point answer and it's what most people type first.
Case 3 (rate, not count). Sightings this month: Amber 84 with 120 lions, Basalt 45 with 60, Cobalt 90 with 140, Dune 66 with 100. Which pack had the most sightings per lion? Amber 0.70, Basalt 0.75, Cobalt 0.64, Dune 0.66. Basalt, with the lowest raw count on the table. Cobalt's 90 is the biggest number on the table and the wrong answer.
Case 4 (chart type). Rangers want to show how one pack's population changed across five years. Which chart? Change over time is a line chart.
Case 5 (at least one). Ten lions are tagged; three of them are collared. A ranger photographs two tagged lions at random, independently. Probability at least one is collared? Neither: 0.7 × 0.7 = 0.49. At least one: 1 − 0.49 = 51%. Both: 0.3 × 0.3 = 9%, the answer to a question that wasn't asked.
Case 6 (weighted average). Three habitat scores of 6, 8 and 5, with weights 0.6, 0.3 and 0.2. Weighted average? (6 × 0.6 + 8 × 0.3 + 5 × 0.2) / (0.6 + 0.3 + 0.2) = (3.6 + 2.4 + 1.0) / 1.1 = 7.0 / 1.1 = 6.36. Forgetting to divide by 1.1 gives 7.0, which looks perfectly plausible and is wrong.
Six questions, six different traps, none of them hard. That's the game.
How it's scored
McKinsey doesn't publish the scoring or a pass mark, and its own page says the result is weighed with the rest of your application. What prep sites and candidates consistently describe is two components: a product score (were the calculations, report entries and case answers right) and a process score (how you got there: what you collected, how you moved through the interface, whether you used the tools, how you paced yourself). The practical implication is the same either way: work in a way you could explain, use the calculator and the Journal, commit to answers, and don't thrash. More in what a Solve score means.
The most expensive mistakes
- Leaving Investigation without the numbers. The phase locks. A missing value can't be fetched later; you'll be estimating in Analysis.
- Doing math in your head during Investigation. There's no calculator there on purpose. Collect now, compute later.
- Not renaming Journal entries. Twelve values labelled by their number are a puzzle you'll solve again under the clock.
- Answering the question you expected instead of the one asked. Points versus percent, adults versus total, count versus rate. Read the last clause of every question twice.
- Treating the six cases as one block. They're unrelated. Miss one, move on. Sunk-cost spirals on case two are how case six goes unanswered.
- Polishing the Report. It's assembly. Five minutes, then the cases.
How to prepare
- Learn the six traps by name. Then look for the trap in every question before you calculate. Most of the time the wording tells you which one it is.
- Drill the four calculations. Percent change, compound growth over two periods, weighted average with odd weights, "at least one" probability. Ten minutes a day on paper with random numbers.
- Practise the Journal habit. Collect, rename, compute later. It feels slow the first time and it's what saves the Analysis phase.
- Run it timed, start to finish. The pacing is the skill. Decide your split beforehand and hold it.
- Play fresh scenarios. Replaying the same numbers tests your memory of them, not your readiness.
How our simulator differs from the real game
- Clock: ours runs 35 minutes, matching what candidates report for the real game (McKinsey doesn't publish it).
- Analysis: ours asks three questions. Candidates report a small number with sub-parts; the exact count varies by report.
- Content: ours is built from public descriptions, with our own island, packs and numbers. It doesn't use McKinsey's data, artwork or questions, and it can't reproduce whatever process signals the real assessment records.
FAQ
What is the Red Rock Study?
The first McKinsey Solve game: a data-analysis exercise about animal populations on an island, in three one-way phases (Investigation, Analysis, Report) followed by six short cases. Candidates report about 35 minutes. It's the game closest to a traditional consulting case.
How long is the Red Rock Study?
About 35 minutes according to prep sites and candidate reports, on its own clock. It's the first game on every current Solve invitation length, followed by Sea Wolf.
Can I go back to an earlier phase in Red Rock?
No. The flow is strictly one-way. Once you confirm Investigation you can't see the brief again, which is why what you collect into the Research Journal decides most outcomes.
What math does Red Rock test?
Percent change and percentage points, compound growth, ratios and rates, weighted averages, mean and median, and simple probability. Nothing beyond arithmetic; the difficulty is speed and reading exactly what was asked.
Is there a calculator in the Red Rock Study?
From Analysis onward, yes, on screen. During Investigation, no; you only have the Research Journal. One prep site advises doing every calculation on the on-screen calculator because the assessment is reported to record its use.
What is the Research Journal?
The panel where you collect values from the brief during Investigation and where your Analysis answers are logged. It's the only thing that carries information forward once a phase locks, so name entries clearly and collect a little more than you think you need.
What's the difference between percent and percentage points?
A rate going from 40% to 50% is up 10 percentage points and up 25 percent. Red Rock asks for one of them and offers both as answers, so read which the question wants before you calculate.
Are the six cases connected to the study?
No. They share the island theme but don't use the study's data, and each is independent. If one stalls you, answer your best guess and move on; the next one is unrelated.
Is this the real McKinsey game?
No. SolveForge rebuilds the publicly documented mechanics so you can practise the flow, with our own scenarios and numbers. The real content and scoring are McKinsey's and aren't published.
Keep going
Next up in the assessment: the Sea Wolf guide, then the Sustainable Futures Lab on 85 and 95-minute invitations. Or zoom out to the full McKinsey Solve guide. Ready to play? Start the free Red Rock scenario.